Takip Edin


-
Yeni Batı Mah. Palandöken Cad. No: 92 Yenimahalle/ANKARA


Determinants of E-commerce Adoption among Consumers in Türkiye: 2023

ABSTRACT
The rapid expansion of e-commerce in Türkiye presents an opportunity to explore the key factors driving consumer adoption. This study examines the determinants influencing e-commerce participation by utilizing microdata from the 2023 Household Information Technologies (IT) Usage Survey conducted by the Turkish Statistical Institute (TÜİK). Employing a probit regression model, the analysis investigates the impact of demographic, socio-economic, and technological factors, including age, gender, education, household income, mobile device ownership, and social media engagement. The findings indicate that younger individuals, those with higher education levels, and individuals with greater social media engagement are more likely to adopt e-commerce. Regional disparities and household size significantly influence adoption patterns. The study highlights the significance of digital literacy, accessibility, and policy measures in enhancing e-commerce adoption, while also providing valuable insights for policymakers in supporting inclusive digital transformation and offering businesses and entrepreneurs guidance to navigate Türkiye’s evolving e-commerce landscape.
Keywords: E-commerce Adoption in Türkiye, Drivers of E-commerce Adoption , E-commerce Consumer Behavior, Demographic Determinants of E-commerce, Socioeconomic Influences on E-commerce, Technological Determinants of E-commerce
ÖZET
Türkiye’de e-ticaretin hızla büyümesi, e-ticaretin tüketiciler arasında kullanımının yaygınlaşmasını belirleyen temel faktörlerin incelenmesine olanak tanımaktadır. Bu çalışma, Türkiye İstatistik Kurumu (TÜİK) tarafından yürütülen 2023 Hanehalkı Bilişim Teknolojileri Kullanım Araştırması’ndan elde edilen mikro verileri kullanarak e-ticaretin benimsenmesini etkileyen unsurları analiz etmektedir. Çalışmada, yaş, cinsiyet, eğitim, hanehalkı geliri, mobil cihaz sahipliği ve sosyal medya kullanımı gibi demografik, sosyo-ekonomik ve teknolojik faktörlerin etkileri probit regresyon modeli ile incelenmiştir. Sonuçlar, genç bireylerin, yüksek eğitim seviyesine sahip kişilerin ve sosyal medya ile daha fazla etkileşimde bulunan bireylerin e-ticareti daha fazla benimsediğini göstermektedir. Ayrıca, bölgesel farklılıklar ve hanehalkı büyüklüğü e-ticaretin benimsenme oranlarını önemli ölçüde etkilemektedir. Çalışma, dijital okuryazarlık, erişilebilirlik ve politika önlemlerinin e-ticaret katılımını artırmadaki önemini vurgulayarak, politika yapıcılara işletmelere ve girişimciler önemli içgörüler sunmaktadır.
Anahtar Kelimeler: Türkiye’de E-ticaretin Benimsenmesi, E-ticaretin Benimsenmesini Etkileyen Faktörler, E-ticaret Tüketici Davranışı, E-ticaretin Demografik Belirleyicileri, E-ticaret Üzerindeki Sosyoekonomik Etkiler, E-ticaretin Teknolojik Belirleyicileri
INTRODUCTION
The rapid growth of e-commerce in Türkiye presents a unique opportunity to examine the factors driving consumer adoption. Over the past decade, e-commerce has emerged as a transformative force, reshaping consumer behavior, retail strategies, and even national economic policies. According to IMARC, the Turkish e-commerce market was valued at $27.8 billion in 2023 and is projected to reach an impressive $245.71 billion by 2032, with a compound annual growth rate of 26.5%. Similarly, the market size in Turkish Liras surged from 53.5 billion in 2016 to an estimated 3,395 billion in 2024. E-commerce’s share of the retail market has also grown significantly, climbing from 4% in 2016 to 18.3% in 2023, while its contribution to GDP has reached 6.8% (Statista, 2024). This remarkable growth demonstrates a clear shift in consumer behavior and preferences towards online shopping in Türkiye, highlighting the sector’s increasing importance within the national economy and its potential to drive innovation and growth.
Given the significance of this transformation, this study investigates the determinants of e-commerce participation in Türkiye by utilizing microdata from the 2023 Household Information Technologies (IT) Usage Survey conducted by the Turkish Statistical Institute (TÜİK). The analysis focuses on three dimensions: demographic and socio-economic factors (age, gender, education, and income), regional and income-based adoption disparities, and the role of technology usage (social media engagement and mobile device ownership). A probit regression model is employed to estimate the effects of these independent variables on e-commerce adoption, defined as whether an individual made an online purchase in 2023.
To provide a comprehensive understanding, this paper is organized into the following sections: The literature review discusses prior research on e-commerce adoption, followed by the methodology section details the dataset and econometric techniques. The findings section presents key results, and the conclusion highlights policy implications and future research directions.
LITERATURE REVIEW
A review of the extant literature reveals that demographic, socio-economic characteristics, and technology usage factors are the primary determinants of individuals’ propensity to engage in e-commerce. For instance, as observed in the study of Andrea and Khoirunnita (2024), highly educated individuals are more likely to adopt e-commerce due to better digital literacy and understanding of online tools. In addition to demographic characteristics, gender is identified as a significant factor on e-commerce adoption (Tutar et al., 2024). As a result of their analysis, they concluded that there was a significant relationship between gender and e-commerce during the Covid-19 period.
Apart from demographic characteristics, factors such as technology usage are also taken into consideration in the studies. Bilik (2023) emphasized how Türkiye’s e-commerce growth is driven by internet penetration, mobile payment methods, and shifting consumer behavior. Furthermore, Bhatt (2019) noted that the increasing accessibility of smart devices has facilitated the widespread use of e-commerce. It is possible to diversify the factors used in different studies. These factors may include perceived ease of use, perceived usefulness, perceived risk with products/services, and perceived risk in the context of online transaction (Lee et al.,2001), power distance, individualism, masculinity, uncertainty avoidance, account ownership, GDP per capita (Ayob, 2021), or lifestyle, as well as spatial factors. The latter may encompass the attractiveness of city centres and the distance to city centers (Wiegandt et al.,2018).
DATA AND METHODOLOGY
The data used in this study is obtained from the Turkish Statistical Institute (TSI) Household Information Technologies (IT) Usage Survey, Micro Data for 2023, which provides individual and household-level statistics. Conducted annually since 2004 (except for 2006), the survey follows EU regulations and is developed in cooperation with Eurostat, OECD, and statistical offices of EU member states. The dataset includes 11,289 households and 24,771 individuals, covering key aspects of digital engagement, internet access, and e-commerce participation.
Table 1: Summary Statistics of Key Variables
| Variable | Observations | Mean | Std. Dev. | Min | Max |
| Age (in years) | 24,771 | 42.31 | 15.82 | 16 | 74 |
| Gender (1 = Female) | 24,771 | 0.494 | 0.500 | 0 | 1 |
| Tertiary Education (1 = Associate degree or above) | 24,771 | 0.212 | 0.409 | 0 | 1 |
| Region (1 = West, 2 = Middle, 3 = East) | 24,771 | 1.80 | 0.86 | 1 | 3 |
| Household Size (No. of members) | 24,771 | 3.64 | 1.73 | 1 | 18 |
| Household Income (Quintile scale: 1–5) | 24,771 | 3.03 | 1.41 | 1 | 5 |
| Employment Status (1 = Employed) | 24,771 | 0.415 | 0.493 | 0 | 1 |
| Mobile Phone Ownership (1 = Yes) | 24,010 | 0.988 | 0.108 | 0 | 1 |
| Social Media Usage (1 = Yes) | 24,771 | 0.833 | 0.373 | 0 | 1 |
| E-commerce Adoption (1 = Yes) | 20,910 | 0.511 | 0.500 | 0 | 1 |
Among the notable findings, mobile phone ownership emerges as a nearly universal characteristic in the sample, with 98.81% of individuals owning a mobile phone, while only 1.19% do not. Despite this small proportion, the lack of mobile phone ownership represents a significant barrier to e-commerce adoption, as digital platforms are primarily accessed through mobile devices. This highlights the critical role of digital infrastructure in enabling e-commerce participation.
Another remarkable observation pertains to social media usage, with 83.29% of the population actively using social media and 16.71% reporting no usage. This considerable non-user segment indicates that a portion of the population may have limited exposure to online shopping platforms, which are frequently promoted via social media channels. The relationship between social media usage and e-commerce adoption is further supported by the significant correlations with tertiary education (0.454) and household income (0.261), suggesting that social media serves not only as a marketing tool but also as a facilitator of digital literacy and online engagement. (see table 2: Pairwise Correlation Matrix)
An interesting insight arises when considering the gap between social media usage, mobile phone ownership, internet access, and e-commerce adoption rates. While 98.81% of individuals in the sample own a mobile phone and 84.41% report having internet access, only 51.06% have adopted e-commerce. Additionally, 83.29% actively use social media, indicating a high level of digital engagement across the population. This may suggest that even among those with robust access to digital infrastructure and platforms, certain barriers persist that deter e-commerce participation. These barriers may include trust issues related to online payments, fear of fraud, or general skepticism toward online shopping platforms, particularly in the context of Türkiye. Understanding these underlying barriers could provide valuable insights for policymakers, businesses, and researchers aiming to address these challenges and enhance e-commerce adoption rates. Future research could focus on identifying the psychological, cultural, or logistical factors that hinder participation to develop targeted interventions and foster broader inclusion in e-commerce.
As illustrated in Table 2, the correlation matrix demonstrates the relationship between two independent variables and the significance levels of this relationship.
Table 2. Pairwise Correlation Matrix
| (1) | (2) | (3) | (4) | (5) | (6) | (7) | (8) | (9) | |
| age | gender | education | region | household_size | household_income | employment | mobile_phone_own. | social_media_use. | |
| (1) age | 1.000 | ||||||||
| (2) gender | 0.003 | 1.000 | |||||||
| (0.586) | |||||||||
| (3) education | -0.415* | -0.144* | 1.000 | ||||||
| (0.000) | (0.000) | ||||||||
| (4) region | -0.062* | -0.001 | -0.122* | 1.000 | |||||
| (0.000) | (0.909) | (0.000) | |||||||
| (5) household_size | -0.319* | 0.000 | -0.063* | 0.196* | 1.000 | ||||
| (0.000) | (0.974) | (0.000) | (0.000) | ||||||
| (6) household_income | -0.151* | -0.046* | 0.396* | -0.192* | 0.117* | 1.000 | |||
| (0.000) | (0.000) | (0.000) | (0.000) | (0.000) | |||||
| (7) employment | -0.187* | -0.384* | 0.333* | -0.087* | 0.016* | 0.294* | 1.000 | ||
| (0.000) | (0.000) | (0.000) | (0.000) | (0.012) | (0.000) | ||||
| (8) mobile_phone_own. | -0.009 (0.153) | -0.061* (0.000) | 0.079* (0.000) | -0.019* (0.004) | -0.045* (0.000) | 0.068* (0.000) | 0.056* (0.000) | 1.000 | |
| (9) social_media_use. | -0.432* (0.000) | -0.109* (0.000) | 0.454* (0.000) | -0.113* (0.000) | 0.069* (0.000) | 0.261* (0.000) | 0.262* (0.000) | 0.111* (0.000) | 1.000 |
| Correlation coefficients are significant at the 0.05 level | |||||||||
The correlation matrix presented in Table 2 demonstrates the relationships between variables considered for the e-commerce adoption study in Türkiye. These correlations and their significance levels provide valuable insights into the interconnections among independent variables, which can influence the model construction and interpretation. A noteworthy correlation is between household income and social media usage, with a coefficient of 0.261 (p < 0.05). This positive relationship indicates that households with higher income levels are more likely to engage with social media platforms. This could be attributed to better internet accessibility and a stronger affinity toward digital tools among higher-income groups. Since social media platforms are often used for marketing and driving e-commerce traffic in Türkiye, this relationship underscores the importance of targeting these groups through digital advertising strategies.
Another important finding is the negative correlation (-0.432, p < 0.05) between age and social media usage, which reflects a generational divide in digital engagement. Younger individuals tend to be more active on social media platforms, indicating that their digital habits might play a role in shaping e-commerce dynamics. This observation aligns with the increasing presence of influencers and targeted advertisements in e-commerce platforms, which appear to resonate particularly with younger consumers, who are more accustomed to online shopping.
For this purpose, a probit model is employed to analyze the determinants of e-commerce adoption, given the binary nature of the dependent variable.
ESTIMATION AND FINDINGS
Dependent Variable
The dependent variable in this analysis is e-commerce adoption, measured as a binary outcome reflecting whether an individual engages with online shopping platforms. In this study, individuals from the raw data who reported making an e-commerce purchase more than one year ago were excluded. This exclusion criterion was applied to focus on active adopters of e-commerce in Türkiye during 2023. Individuals who engaged in e-commerce activities more than a year ago may not represent sustained adoption of e-commerce, as their behavior could be attributed to occasional or experimental usage rather than habitual engagement. By narrowing the sample to those with more recent e-commerce activity, the analysis aims to better identify the factors influencing active e-commerce adoption. As a result, 3861 observations were excluded, reducing the final sample size to 20,910.
Individuals who have engaged with e-commerce platforms for online shopping are coded as 1, while those who have not are coded as 0. The dataset reveals that 48.94% of the individuals in the sample have adopted e-commerce, whereas 51.06% have not.
Independent Variables
In this study, several socio-economic, demographic, and technological characteristics are used as independent variables, such as household income, household size, age, education level, social media usage, mobile phone ownership. However, in certain cases, continuous variables are also categorized to better understand the concentration or behavior of specific groups. Detailed explanations of these dummy variables are presented in Table 3.
Table 3: Explanations of Dummy Variables
| Dummy Variables | Explanations |
| Age | Age is used as a continuous variable in certain models to capture linear or non-linear effects. Additionally, age is categorized into six groups: 16-24, 25-34, 35-44, 45-54, 55-64, and 65-74. Individuals in each group are coded as 1, others as 0. |
| Gender | In the raw data, male was coded as 1 and female as 2. Female is recoded as 0, and male remains as 1. |
| Education | Education is used as a binary variable (1 = individual has completed tertiary education, 0 = otherwise) for descriptive statistics and correlation matrix analyses. Tertiary education includes those who have completed a 2-year college (associate degree), a bachelor’s degree, or a graduate degree (master’s or doctorate). In regression models, education is categorized into five groups: No formal education, Primary school, Secondary school, High school, and Higher education (associate degree or above), and dummy variables are created accordingly. |
| Region | Based on the Statistical Regional Units Classification (Level 1) regions are grouped into three broader categories: West: Includes TR1, TR2, TR3, TR4, TR5. Middle: Includes TR6, TR7, TR8. East: Includes TR9, TRA, TRB, TRC. Dummy variables are created for each group, where regions belonging to a specific group are coded as 1, and others as 0. |
| Household Size (HHS) | Household size is used as a continuous variable in certain models to capture linear or non-linear effects. Additionally, household size is categorized into three groups: 1-2 persons, 3-5 persons, and 6 or more persons. |
| Household Income | Based on the raw data from TÜİK, household income is categorized into five quintiles representing the net monthly income of households (lowest 20% to highest 20%). No additional dummy variables were created as the quintiles were used directly. |
| Employment | Based on the question “Did you work in the past week?”, the raw data was recoded. Individuals who worked are coded as 1, while those who did not work (categories 2 and 3) are coded as 0. |
| Mobile Phone Ownership | Based on the question “Do you own a mobile phone?”, in the raw data yes was coded as 1 and No as 2. No is recoded as 0, and yes remains as 1. |
| Social Media Usage | Based on the usage of platforms such as WhatsApp, Instagram, YouTube, Facebook, and others, individuals who use any of these platforms are coded as 1, while non-users are coded as 0. |
To improve model interpretability, age is categorized into six groups, while education and region follow a structured classification. Household size is included both as a continuous variable and categorized into three groups (1–2, 3–5, and 6+ persons) to assess non-linear effects. By simplifying the household size into three distinct groups, the analysis becomes more focused and interpretable, particularly in understanding whether smaller, medium-sized, or larger households have different e-commerce adoption behaviors.
Additionally, regional classification follows the NUTS-1 framework but is grouped into three broader categories (west, central, east) to better capture economic and infrastructural similarities.
FINDINGS
The marginal effects of the probit regression models are presented in Table 4. Among the models estimated, Model 6 is preferable because it is statistically significant, helps to understand various variables and is in line with the literature.
Table 4: Estimation results for probit models for Version 1 (marginal effects in percentage points)
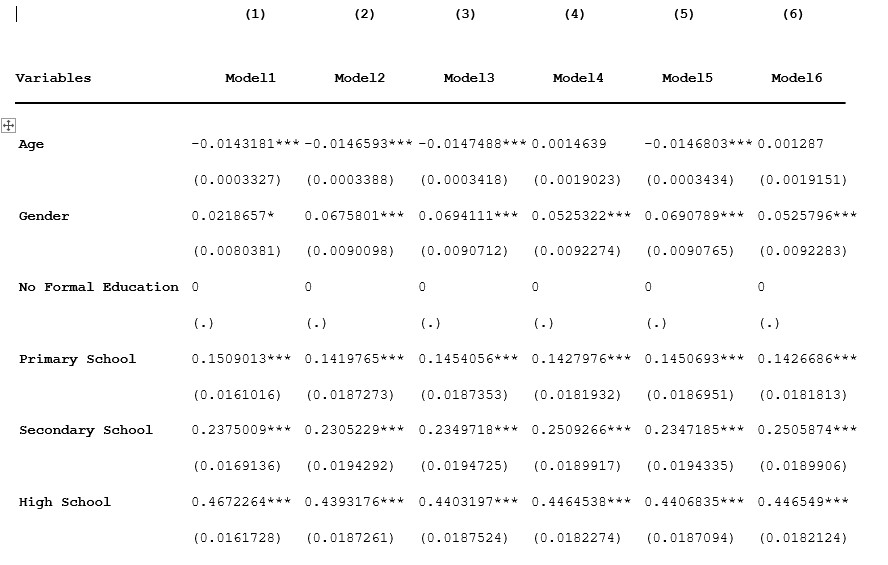
The result of our analysis related with age is in parallel with the study conducted by Tutar et al. (2024) showing a decline in e-commerce adoption with increasing age. In the 6th model, the observation that the effect of age is less than the other models may be related to the social media usage and mobile phone ownership included in the model. The effect of these two variables may have reduced the effect of age. In addition, it can be interpreted that when age is added to the squared model, the change in the sign of age initially increases and then decreases the effect of age on e-commerce adaptation in an inverted U shape. Although the effect of age is less significant in Model 6 compared to other models, the marginal effect of age is 0.13%, with the squared term of age being -0.02% (p < 0.01), which supports this argument. The underlying reasons for these outcomes may be attributed to the challenges associated with adopting new shopping habits at advanced ages, diminished familiarity with contemporary technologies, and a degree of skepticism towards the relatively recent phenomenon of e-commerce (Akhter, 2003; Botwinick, 1973; Gilly et al., 1985; Phillips et al., 1977; Porter et al., 1979).
There are different approaches to gender and e-commerce adoption in the literature. In some studies (Alqahtani,et al., 2018), it is observed that female customers have more e-commerce adoption, while in many others (Escobar-Rodriguez et al., 2017; Fransi et al., 2015) it is observed that male customers have more e-commerce adoption. Our findings indicate that if a person is male e-commerce adoption probability increased by 5.26% (p < 0.01), which is strongly in parallel with the majority of the literature, establish a positive relationship between male customers and e-commerce adoption. One possible explanation for this relationship is that many societies remain patriarchal, where men traditionally have greater financial control and easier access to economic resources.
Our study’s education result is in parallel with the literature. As Özekenci et al. (2019) and Vicente (2014) emphasized, there is a positive relationship between education level and e-commerce adoption. The reason for this relationship may be that people with more advanced education are more open or exposed to new technologies. Or people who can read a lot may have a better financial situation. This situation can be associated with the fact that in Vicente’s study, more educated people are engaged in purchasing activities and less educated people are engaged in sales activities. In addition, as Bilik (2003) states, it is important to be at a certain level of education for the basic knowledge and competences required for e-commerce.
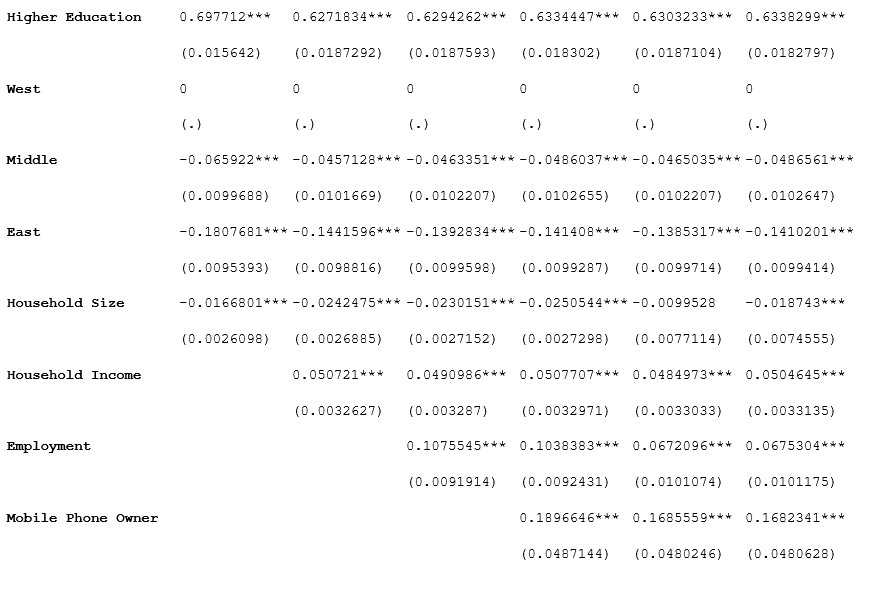
Our analyses on region show parallels with the literature. As in the study of (Wang et al., 2021), the reason why there is a positive relationship between region and e-commerce adoption is that the industry and capital are more concentrated in a certain part of the country and e-commerce adoption is observed more in the western part of the country due to financial resources.
Another variable in parallel with the literature is household size. The value we found in our study is -1.87% (p < 0.01). As stated in Zhou and Wang study (2014), as the family size increases, there is a decrease in e-commerce adoption. Larger households may be less likely to engage in e-commerce due to traditional shopping preferences, shared shopping responsibilities, and reliance on physical stores.
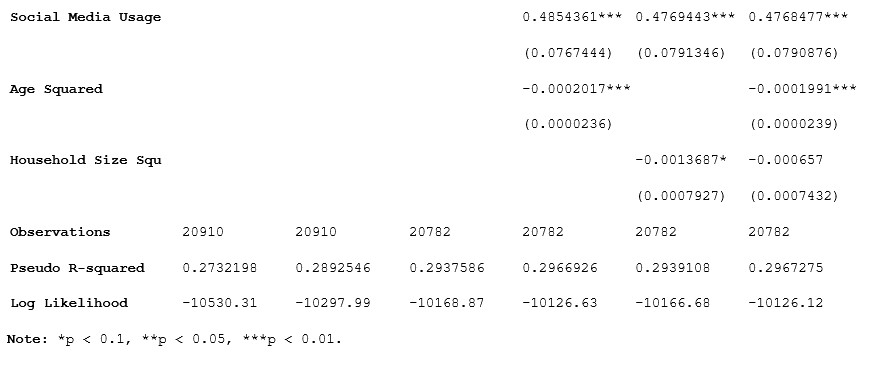
A positive correlation has been demonstrated between household income and e-commerce. The present study is consistent with the extant literature (Hashim et al., 2009; Doherty & EllisChadwick, 2003; Koyuncu & Lien 2003). The fundamental logic behind this phenomenon is that an increase in household income, which concomitantly increases spending capacity, can positively affect the potential for e-commerce adoption.The present study is consistent on employment with numerous examples from the extant literature, including those of Ünver and Alkan (2021), Badircea et al. (2022). The marginal effect of employment status on e-commerce adoption, estimated at 6.75%, aligns with the findings reported in the existing body of literature. This indicates that employed individuals are 6.75% more likely to adopt e-commerce compared to those who are not employed. The employed people’s work environment and life routines may encourage e-commerce adoption. For example, a white-collar worker who works five days a week from morning to night can order a dress for a nearby ceremony from the internet because he/she is unable to visit physical stores during business hours.
Our study results on the relationship between mobile phone usage and e-commerce is strongly related to the literature (Devarakonda et al., 2020; Einav et al., 2014; Emon et al., 2023; Eryüzlü, 2020). Options such as ease of use, internet access, obtaining first-hand information and opinions about companies, second-hand information and opinions about products, and sharing experiences quickly with sellers and other potential customers may be the reason for this positive relationship. The positive relationship between social media and e-commerce adoption is evidenced by the literature and the millions of dollars spent by companies. As Valerio (2019), Chambers (2005) or Lai (2010) stated in the literature and the results we reached in our study indicates, there is a positive relationship between social media use and e-commerce adoption. People may be encouraged to shop online thanks to the advertisements exposed on social media platforms, referrals to e-shopping sites through applications, observation of more products directly (visiting manufacturer pages) and indirectly (viewing the products used by the people followed).
Table 5 shows the results of the analysis we conducted in order to see the effects of age and house size groups. In this analysis, Model 3 stands out with its explanation of more variables, statistical significance and parallelism with the literature.
Table 5: Estimation results for probit models for Version 2 (marginal effects in percentage points)
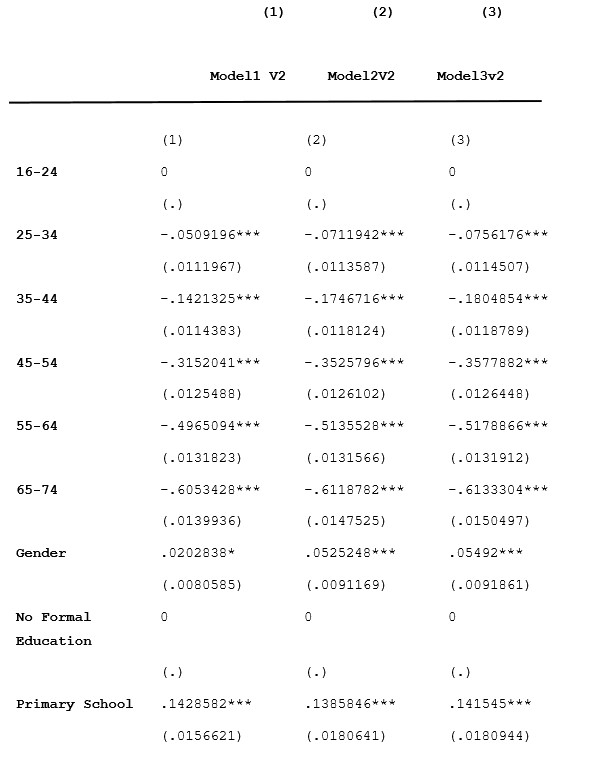
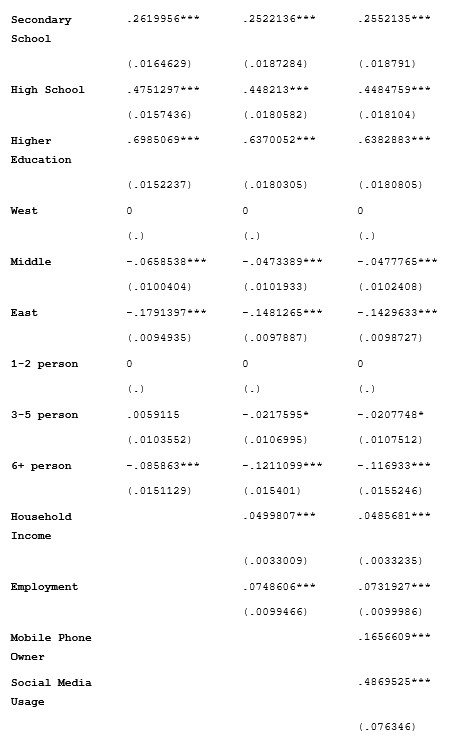

The sharp negative effects in the 45–54 (-35.78%) and 55–64 (-51.79%) age groups highlight a substantial decline in adoption likelihood compared to the 16–24 baseline. This decline aligns with generational resistance, as these groups developed habits before the widespread use of the internet in Türkiye. Considering that the internet has become widespread in Türkiye since the mid-90s, it can be said that the 45-54 and 55-64 age groups spent their early years developing their habits in a period when the internet was not very widespread. This can affect e-commerce adaptation more sharply.
For household size, families with 6 or more members show a significant negative effect (-11.69%) on e-commerce adoption, about five times greater than the -2.07% observed for families with 3–5 members. Larger households may rely more on traditional shopping, driven by bulk purchasing needs or younger members shopping in physical stores. These results reveal clear disparities, emphasizing the need to target older age groups and larger households to improve e-commerce adoption.
CONCLUSION
The findings of the study demonstrate that the degree to which e-commerce adapts to new circumstances is significantly influenced by the demographic, socioeconomic and technology usage characteristics of individuals. While factors such as higher education level, higher income level, social media usage and mobile phone ownership have a positive effect on adaptation, age and regional differences creates differences in adaptation. These findings indicate that e-commerce platforms should customise their strategies according to regional and demographic segments in order to reach a wider user base. The results reveal notable concentrations in e-commerce adoption disparities across age groups and household sizes. The decline in adoption probability starting from the 45–54 age group and the pronounced challenges faced by larger families underline critical areas for targeted interventions. Promoting digital literacy among older age groups and addressing logistical constraints for larger households could significantly enhance e-commerce adoption rates in these segments. It is imperative that policymakers who aspire to augment e-commerce consider the development of a legislative infrastructure that will facilitate the creation of applications designed to encourage the adoption of e-commerce by more mature age groups.
Moreover, it is crucial that these policymakers allocate resources to the promotion of e-commerce incentives in regions outside of the West, with a particular focus on the East. It is imperative that relevant policymakers direct their attention to the enhancement of infrastructure within these regions. In the Eastern and Western regions, there is a necessity to address issues such as internet infrastructure and digital literacy. Since the study only uses data from 2023, it has a limitation in that it cannot provide information about the changes in the factors affecting e-commerce adaptation over time, but this is also an opportunity for future studies. The fact that it only includes data from Türkiye can be perceived as a limitation, but it is also important to conduct country-focused studies to observe the effects of various factors, such as cultural influences, that are not taken into account.
In conclusion, the findings indicate that there is significant digital interaction among individuals in Turkey, as evidenced by data such as high mobile phone ownership rates (98.81%), internet access (84.41%), and social media usage (83.29%). However, the e-commerce adoption rate is relatively low at 51.06%. This could be indicative of the presence of non-technological barriers, such as distrust, concerns regarding fraud, or cultural scepticism, which hinder widespread participation in e-commerce. Future research endeavours should focus on exploring these barriers in greater depth, gaining a more nuanced understanding of their impact, and devising effective strategies to overcome them.
REFERENCES
Akhter, S. H. (2003). Digital Divide and purchase intention: Why demographic psychology matters. Journal of Economic Psychology, 24(3), 321–327. https://doi.org/10.1016/s0167-4870(02)00171-x
Andrea, R., & Khoirunnita, A. (2024). E-commerce information system for marketingagricultural products in Kutai Kartanegararegency. International Journal of Information Engineering and Electronic Business, 16(6), 62–70. https://doi.org/10.5815/ijieeb.2024.06.05
Alqahtani, A. S., Goodwin, R. D., & de Vries, D. B. (2018). Cultural factors influencing e-commerce usability in Saudi Arabia. International Journal of Advanced and Applied Sciences, 5(6), 1–10.doi:10.21833/ijaas.2018.06.001
Ayob, A.H. E-commerce adoption in ASEAN: who and where?. Futur Bus J 7, 4 (2021). https://doi.org/10.1186/s43093-020-00051-8
Bhatt S. (2019). An empirical analysis of online shopping behavior in India: A demographic perspective. Asia-Pacific Management Accounting Journal, 14(3), 181–202. Crossref. Web of Science.
Bilik, M. (2023). Analyzing challenges and opportunities in the e-commerce industry of Turkey. İzmir İktisat Dergisi, 38(4), 1138–1151. https://doi.org/10.24988/ije.1262286
Botwinick, J. (1973). Aging and behavior. New York: Springer
Devarakonda, S., Kodati, C., Rama Teja Reddy, M., Ravindranath Reddy, T., & Srinivas, V. (2020). Impact of smart phones on e-commerce in transforming customer engagement. International Journal of Advanced Research, 8(4), 1110–1119. https://doi.org/10.21474/ijar01/10884
Einav, L., Levin, J., Popov, I., & Sundaresan, N. (2014). Growth, Adoption, and Use of Mobile E-Commerce American Economic Review. American Economic Review, 104(5), 489-494. doi:10.1257/aer.104.5.489
Emon, M. M. (2023). A systematic review of the causes and consequences of price hikes in Bangladesh. Review of Business and Economics Studies, 11(2), 49–58. https://doi.org/10.26794/2308-944x-2023-11-2-49-58
Eryüzlü, H. (2020). E-Ticaretin Enflasyona Etkileri: Türkiye Örneği. Selçuk Üniversitesi Sosyal Bilimler Meslek Yüksekokulu Dergisi, 23(2), 394-400. https://doi.org/10.29249/selcuksbmyd.637665
IMARC Group. (n.d.). Turkey e-commerce market report by type (home appliances, apparel,
footwear and accessories, books, cosmetics, groceries, and others), transaction (business-to-consumer, business-to-business, consumer-to-consumer, and others), and region 2024-2032. Retrieved from https://www.imarcgroup.com/turkey-e-commerce-market
Koyuncu, C., & Lien, D. (2003). E-commerce and consumer’s purchasing behaviour. Applied Economics, 35(6), 721–726. https://doi.org/10.1080/0003684022000020850
Lee, D., Park, J., & Ahn, J. H. (2001). On the explanation of factors affecting e-commerce adoption. ICIS 2001 Proceedings, 14
Özekenci, E. K., Gülmez, M., & Ünver Erbas, C. (2019). The Determınants Of E-Commerce In Turkey And European Countrıes: A Panel Data Analysıs. Journal of Business in The Digital Age, 2(1), 15-23.
Phillips, L. W., & Sternthal, B. (1977). Age differences in information processing: A perspective on the aged consumer. Journal of Marketing Research, 14(4), 444–457. https://doi.org/10.1177/002224377701400402
Porter, T. C., Swerdlow, R. A., & Staples, W. A. (1979). Who uses Bank debit cards? Business Horizons, 22(1), 75–83. https://doi.org/10.1016/0007-6813(79)90111-3
Statista. (2024). E-commerce in Turkey: Market Trends and Forecast. Retreieved from E-commerce in Turkey – statistics & facts | Statista
Statista. (20024). Social media advertising spending worldwide from 2019 to 2029. Retreived from Social media advertising spending worldwide from 2019 to 2029 – statis
Tutar, G., Küçükoğlu, H., Özdemir, A., Alkan, Ö., & Ipekten, O. B. (2024). An investigation of gender differences in e-commerce shopping frequency during COVID-19: Evidence from Türkiye. Sage Open, 14(4). https://doi.org/10.1177/21582440241287630
Ünver, S., & Alkan, Ö. (2021). Determinants of e-commerce use at different educational levels: Empirical evidence from Turkey. International Journal of Advanced Computer Science and Applications, 12(3). https://doi.org/10.14569/ijacsa.2021.0120305
Vicente, M. R. (2014). Determinants of C2C e-commerce: An empirical analysis of the use of online auction websites among Europeans. Applied Economics Letters, 22(12), 978–981. https://doi.org/10.1080/13504851.2014.993127
Wang, F., Wang, M., & Yuan, S. (2021). Spatial Diffusion of E-Commerce in China’s Counties: Based on the Perspective of Regional Inequality. Land, 10(11), 1141. https://doi.org/10.3390/land10111141
Wiegandt, C. C., Baumgart, S., Hangebruch, N., Holtermann, L., Krajewski, C., Mensing, M., … Zucknik, B. (2018). Determinants of online shopping – an empirical study in six North Rhine-Westphalian city regions. Raumforschung Und Raumordnung-Spatial Research and Planning, 76(3), 247–265. doi:10.100713147-018-0532-5
Zhou, Y., & Wang, X. (Cara). (2014). Explore the relationship between online shopping and shopping trips: An analysis with the 2009 NHTS Data. Transportation Research Part A: Policy and Practice, 70, 1–9. https://doi.org/10.1016/j.tra.2014.09.014
Yazar Hakkında
Songül ESMER
2000 yılında Ankara Atatürk Anadolu Lisesi’nden, 2005 yılında Dokuz Eylül Üniversitesi İşletme Bölümü’nden mezun olmuştur. Üniversite mezuniyetini takiben finans ve bütçe yönetimi alanlarında beş yıl özel sektörde görev aldıktan sonra 2012’de yurda dönmüş, 2013’te Gümrük ve Ticaret Bakanlığı’nda gümrük ve ticaret uzman yardımcısı olarak kamudaki görevine başlamıştır. 2018’den bu yana Ticaret Bakanlığı’nda Ticaret Uzmanı olarak görev yapmaktadır. 2021’de Orta Doğu Teknik Üniversitesi (ODTÜ) Felsefe Bölümü’nde “Amartya Sen’s Capability Approach and its Relation with John Rawls’s Justice as Fairness” başlıklı teziyle yüksek lisansını tamamlayan yazar, ODTÜ Bilim ve Teknoloji Politikası Çalışmaları doktora programına devam etmektedir. İleri düzey İngilizce, orta düzey Rusça ve temel düzey Fransızca bilmektedir.
Mehmet Serhat AKÇAY
2015 yılında Denizli Aydem Fen Lisesi’nden, 2020 yılında Orta Doğu Teknik Üniversitesi İşletme Bölümü’nden mezun olmuştur. İş hayatına lisans öğreniminin son senesinde ODTÜ TEKNOKENT Yönetim’de başlamıştır. 2021 yılında ODTÜ Bilim ve Teknoloji Politikası Çalışmaları bölümünde tezli yüksek lisans öğrenimine başlamış ve 2024 yılında yeşil enerji politikaları ve girişimcilik odağındaki tezini yayınlayarak yüksek lisansını tamamlamıştır. İlgili tez çalışması Yenilenebilir Enerji Kamu Yönetişimi: Karşılaştırmalı Bir Bakış kitabında yer almıştır. Yüksek lisansı akabinde doktora eğitimine ODTÜ Bilim ve Teknoloji Politikası Çalışmaları bölümünde devam eden yazar, ODTÜ TEKNOKENT Yönetim akabinde Beko’da ve Bilkent CYBERPARK Yönetim’de girişimciliği ve inovasyonu destekleyen görevler almıştır. 2025 yılı itibari ile HAVELSAN’da Ar-Ge uzmanı olarak çalışmalarına devam etmektedir. Odi (Öğrenci Dostu İşletme) girişiminin de kurucuları arasında yer alan yazar, profesyonel düzeyde İngilizce ve başlangıç seviyesinde Almanca ve İspanyolca bilmektedir.
İçindekiler

Yönetim Kurulundan
Yayın Kurulundan

AI War: Rise of Chatbots

Australasian Recycling Label Sistemi ile Sürdürülebilir Tüketimi Yönlendirmek: Etiketleme Politikalarının Avustralya’da Tüketici Davranışı Üzerindeki Etkileri

Avrupa Birliğinden Birlikler Avrupası’na: Gümrük Birliği Örneği

Çok Kutuplu Küresel Ticarette Yeni Açılım Arayışları
Determinants of E-commerce Adoption among Consumers in Türkiye: 2023

Gümrük Kanunda Yer Alan Tasfiye Hükümleri Çerçevesinde E-İhale Süreçleri

Gümrük ve Maliye Mevzuatı Açısından Transit Ticaret İşlemleri

Gümrüklerde Yapay Zekâ Çağı: Dijitalleşme ve Ticaretin Geleceği

Ticaret Bakanlığı Personelinin Emekliliğinde Silah Taşıma ve Bulundurma Hakkına Yönelik Bir Değerlendirme

Ticari Defterlerin Elektronik Ortamda Tutulması

Ticaret Politikası ve Sürdürülebilirlik: Kamusal Yaklaşımlar
Ticaret Uzmanları Derneği (TİUD), Ticaret Uzmanları ile Uzman Yardımcılarının dayanışma ve birlikteliğini geliştirmeyi, ortak hak ve menfaatlerini korumayı, mesleki, sosyal ve kültürel gelişimlerine katkıda bulunmayı amaçlayan bir sivil toplum kuruluşudur.
Ticaret Uzmanları Derneği (TİUD), Ticaret Uzmanları ile Uzman Yardımcılarının dayanışma ve birlikteliğini geliştirmeyi, ortak hak ve menfaatlerini korumayı, mesleki, sosyal ve kültürel gelişimlerine katkıda bulunmayı amaçlayan bir sivil toplum kuruluşudur.